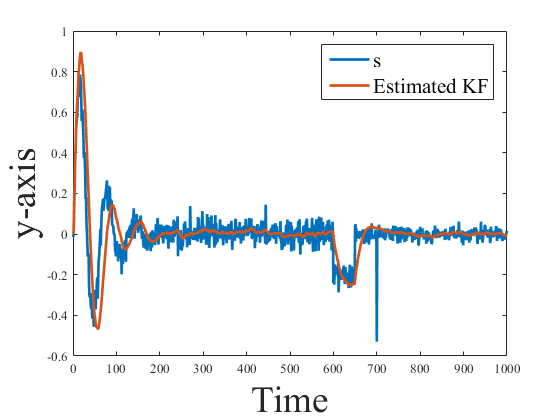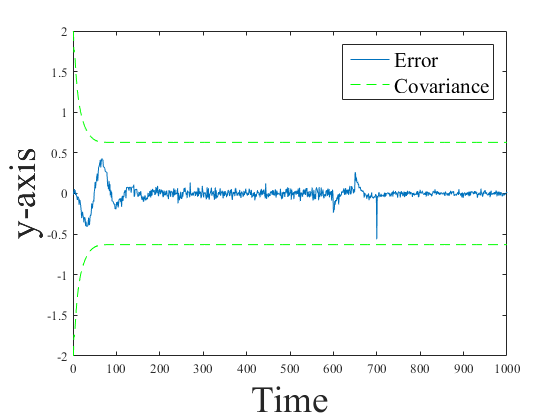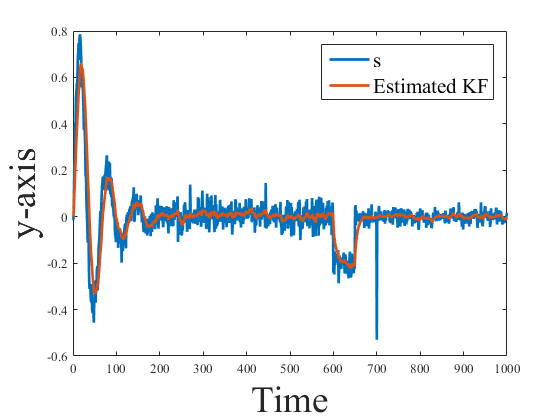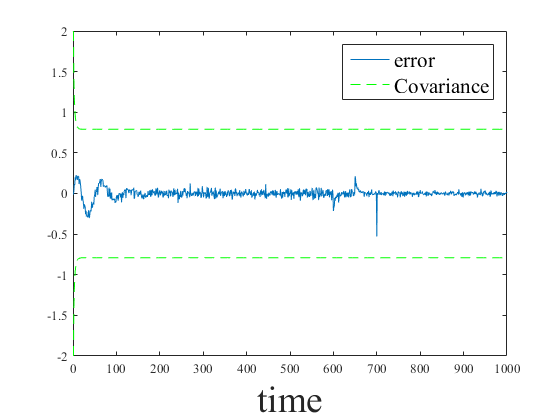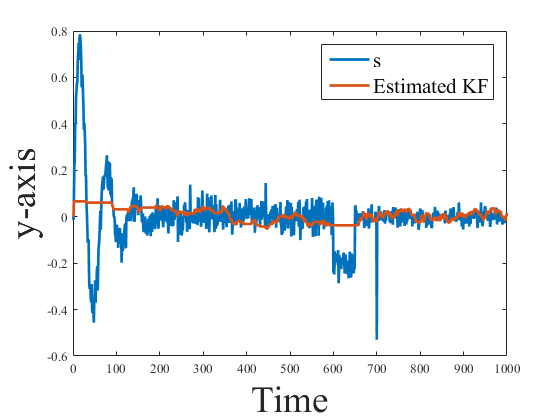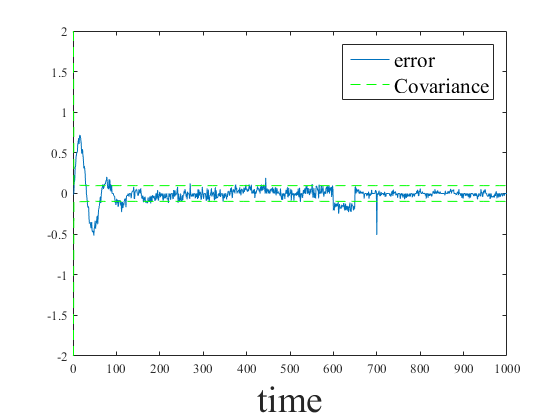

clear
close all
load('signal');


%Measurement noise
Rvv=2.2^2;

%Process noise
Rww=[0 0;0 0.008]^2;

%System Model
A=[1 1; 0 1];
C=[1 0];

%Initialization
P0 = diag([2^2 2^2]);
MD_act=1;
M_D_val=10;


[x,K,P,M_D]= m_KF(A,C,P0,y_s1,Rww,Rvv,1,0.1);

    %Plot signal and filtered signal
    figure(1)
    p1=plot(y_s1,'LineWidth',2);
    hold on
    p2=plot(x(1,:),'LineWidth',2);
    legend([p1 p2],'x','x-est')
    ylabel('y-axis','FontSize', 28);
    xlabel('Time', 'FontSize',28);
    legend({'s','Estimated KF'},'FontSize',16)
    set(gca,'FontName','Times');

    %Plot the error and the covariance
    figure(2)
    plot(y_s1-x(1,:));
    hold on
    plot(sqrt(squeeze(P(1,1,:))),'--','Color','G');
    plot(-sqrt(squeeze(P(1,1,:))),'--','Color','G');
    ylabel('y-axis','FontSize', 28);
    xlabel('Time', 'FontSize',28);
    legend({'Error','Covariance'},'FontSize',16)
    set(gca,'FontName','Times');